The table shows the development of different social media.
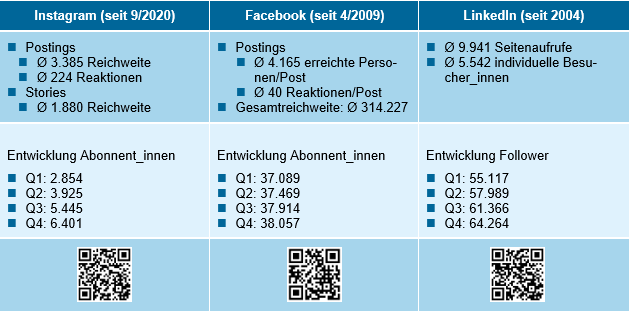
On the far left we see Instagram, the posts had an average reach of 3,385 and there was an average of 224 reactions. Stories had an average reach of 1,880. We gained 3,547 subscribers over the year.
On Facebook, we reached an average of 4,165 people per post and 40 reactions per post, giving us an average total reach of 314,227. We gained 968 subscribers over the year.
On LinkedIn, we had an average of 9,941 page views and an average of 5,542 unique visitors. We gained 9,147 followers over the year.
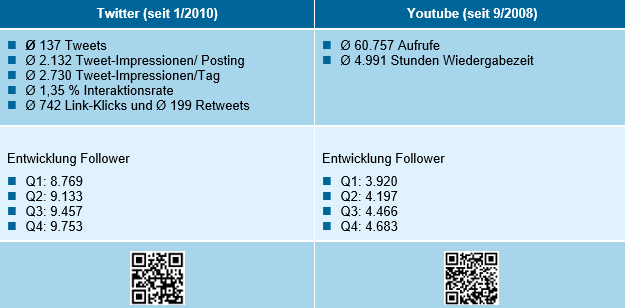
On Twitter, we had 127 tweets, an average of 2,132 tweet impressions per post and an average of 2,730 tweet impressions per day. This gave us an interaction rate of about 1.35 percent. Our links were clicked an average of 742 times and we had an average of 199 retweets. We gained 984 new followers over the year.
On Youtube, we have an average of 60,757 views on an average of 4,991 hours of playback time. We gained 763 new followers over the year.